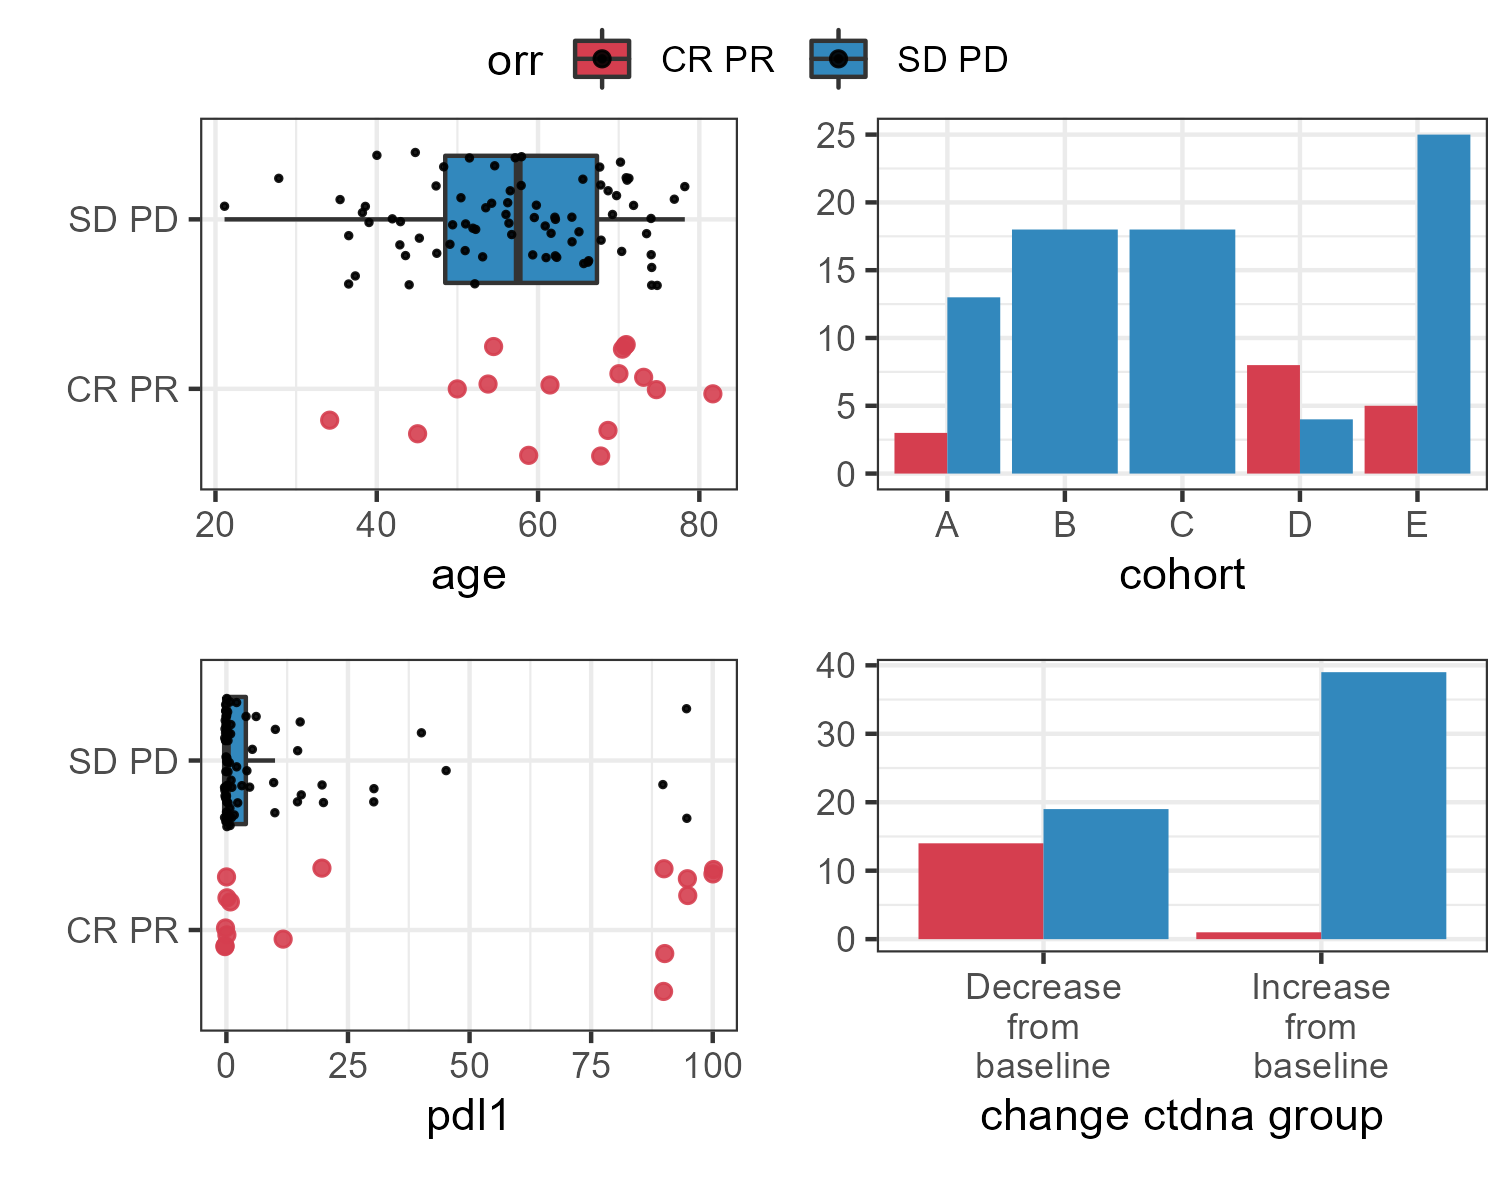
13.1 Plotting bivariate relationships
These plots are designed for quick inspection of many variables, not for publication. This is the plotting version of rm_uvsum. As of 0.1.1 the variable names will be replaced by variable labels if they exist.
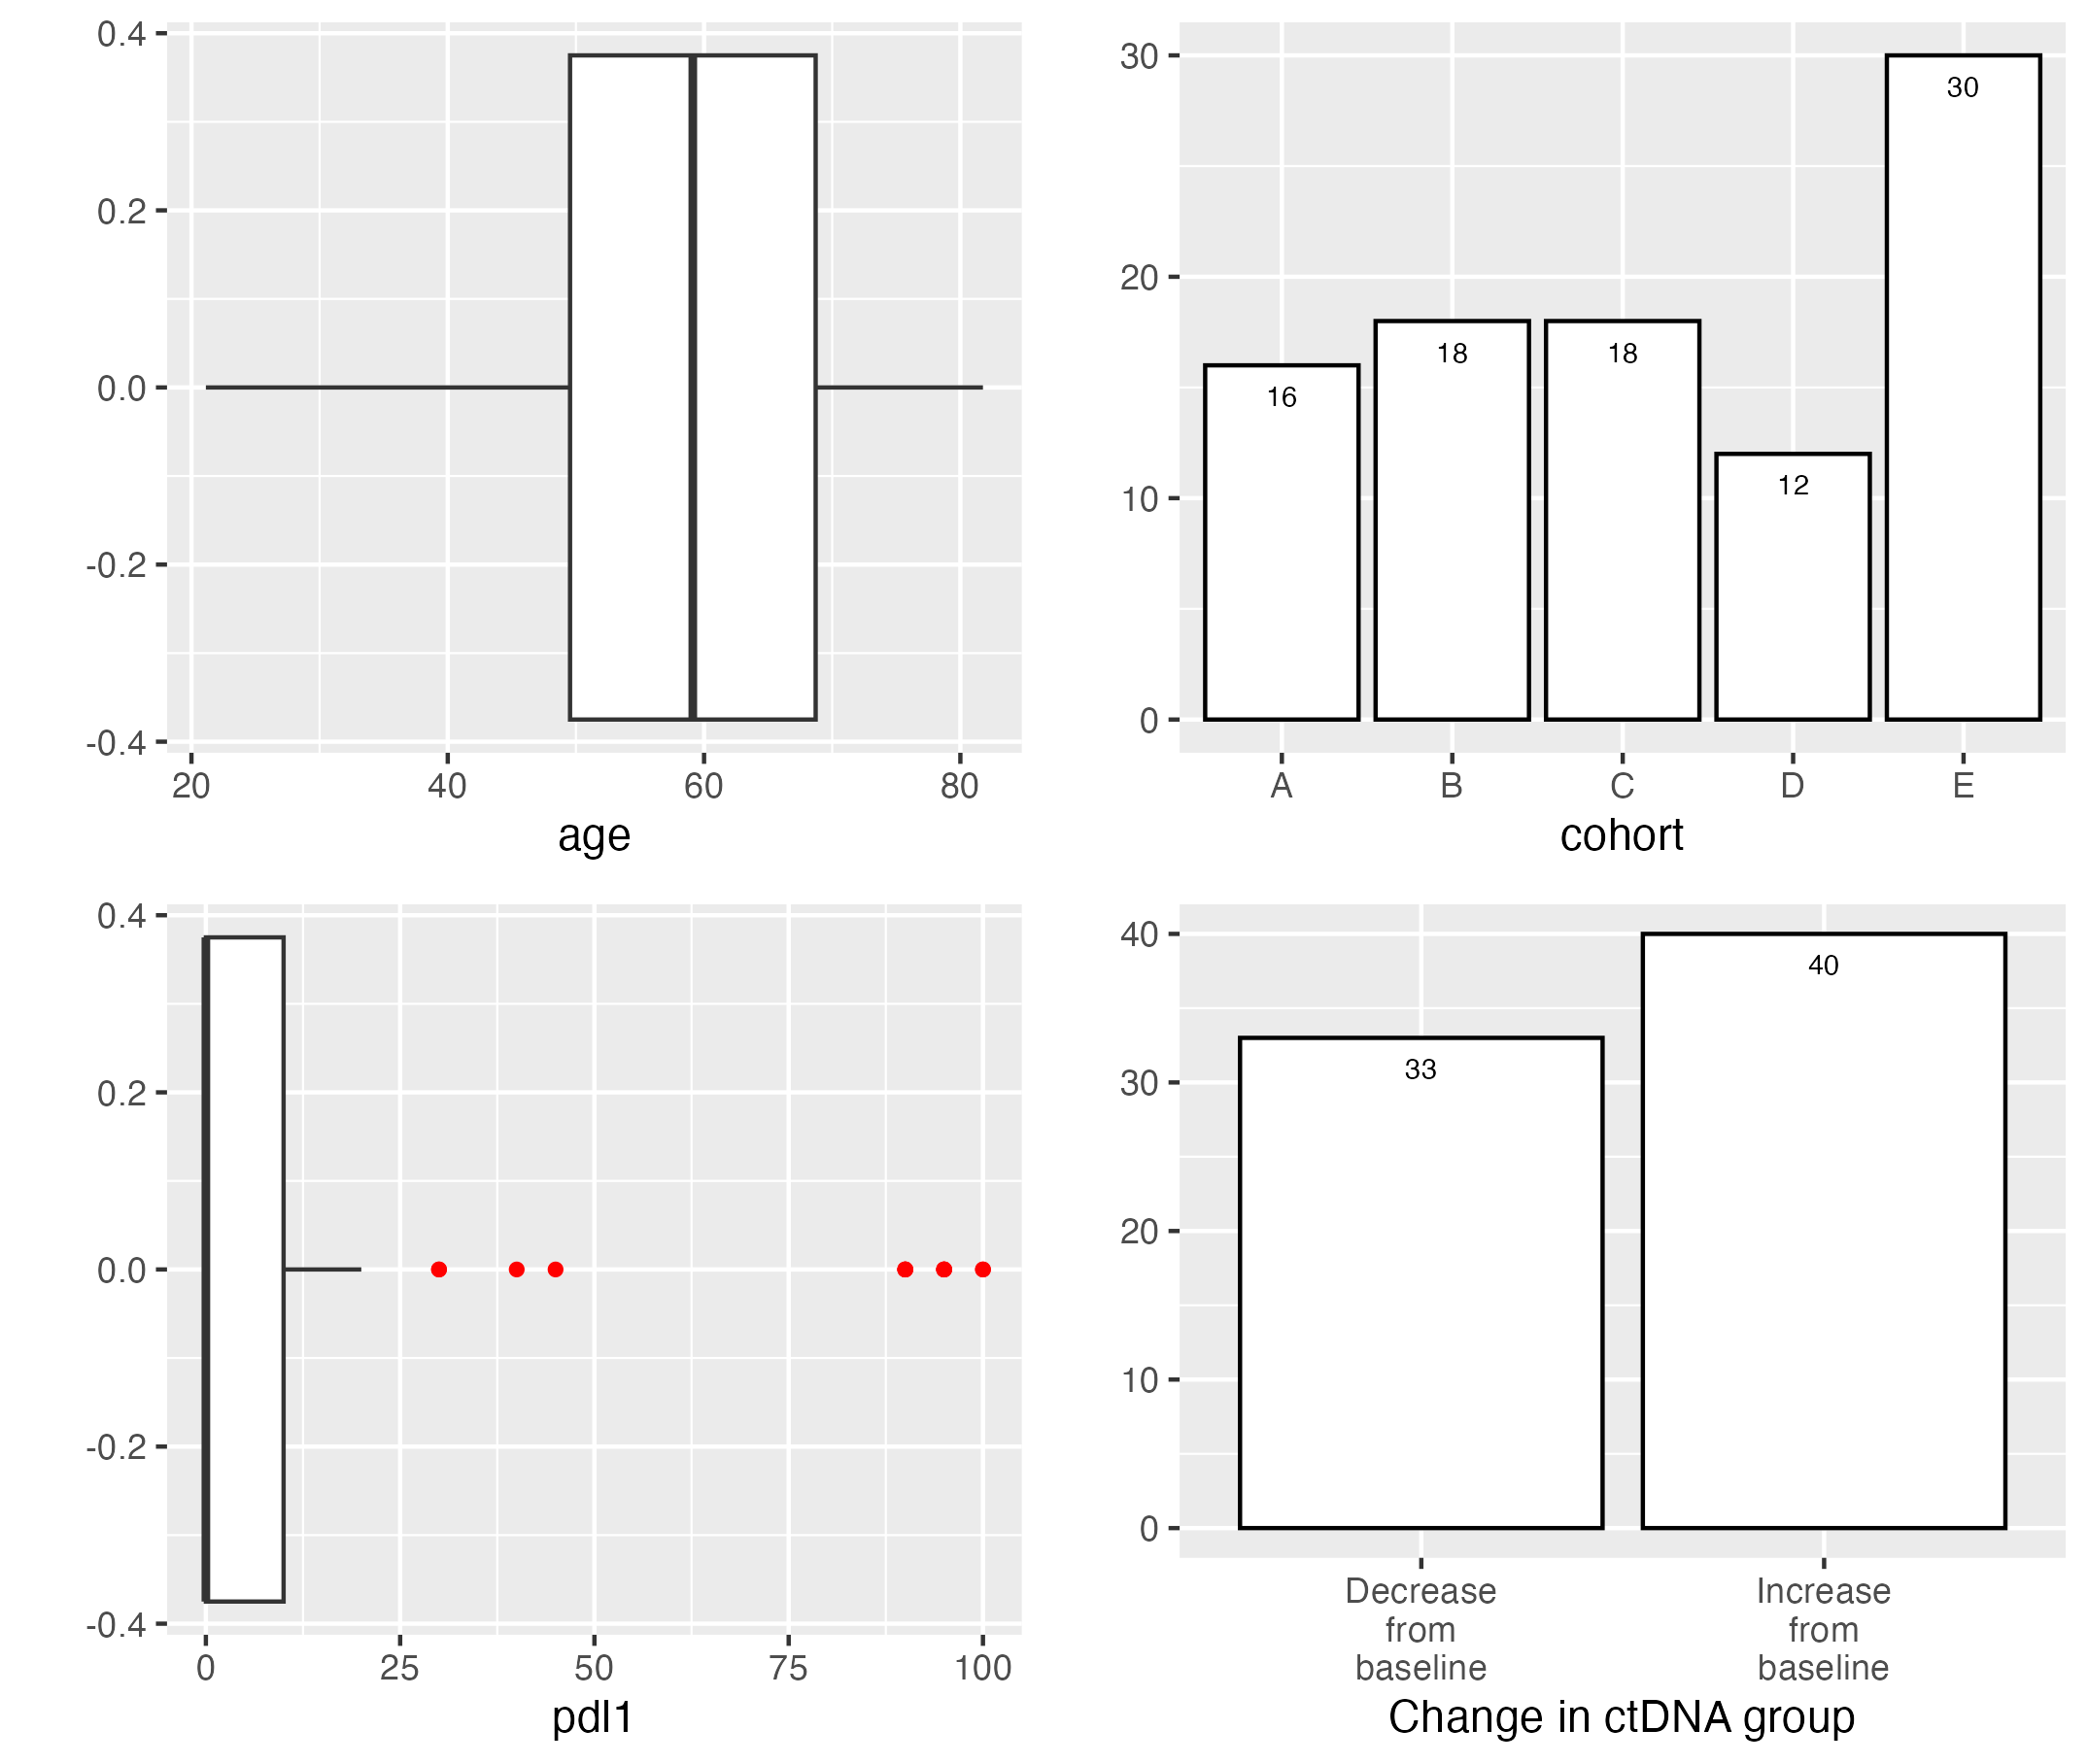
The plotuv function can also be used without a response variable to display summary of variables