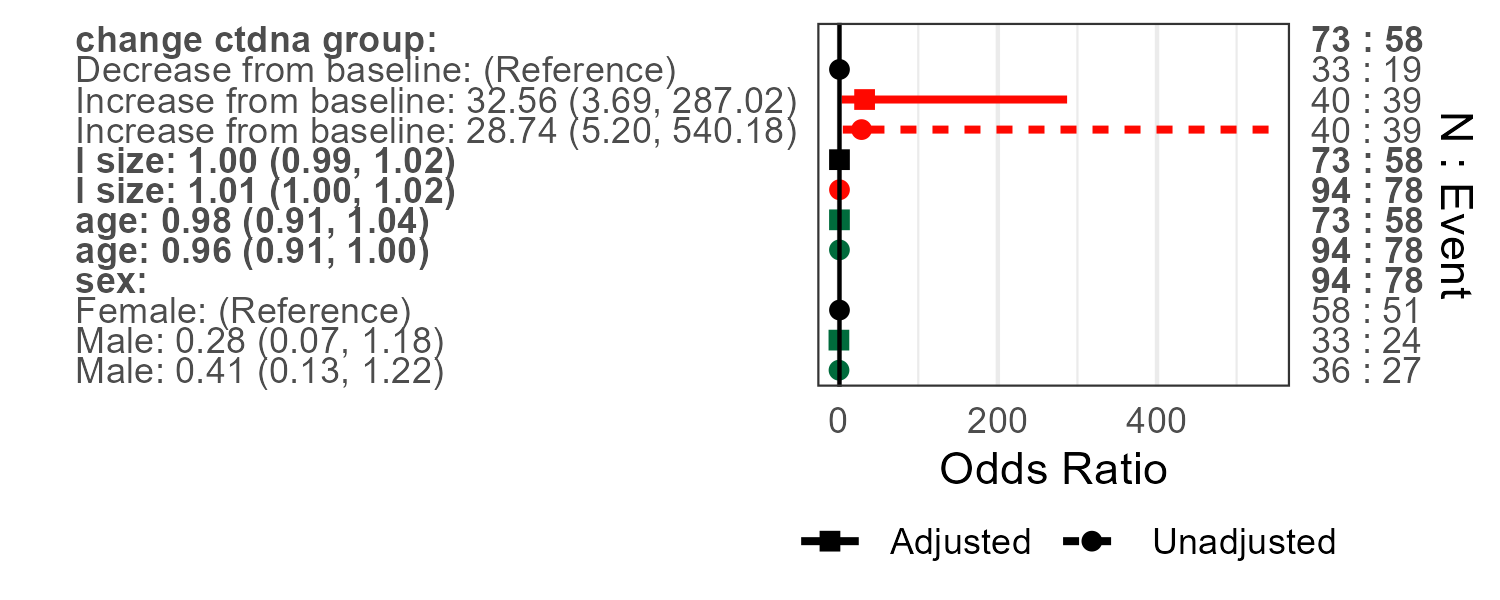
13.4 Combining univariable and multivariable models into a single plot
UVp = forestplotUV(response="orr", covs=c("change_ctdna_group", "sex", "age",
 "l_size"), data=pembrolizumab, family='binomial')
 MVp = forestplotMV(glm(orr~change_ctdna_group+sex+age+l_size,
 data=pembrolizumab,family = 'binomial'))
 forestplotUVMV(UVp, MVp)
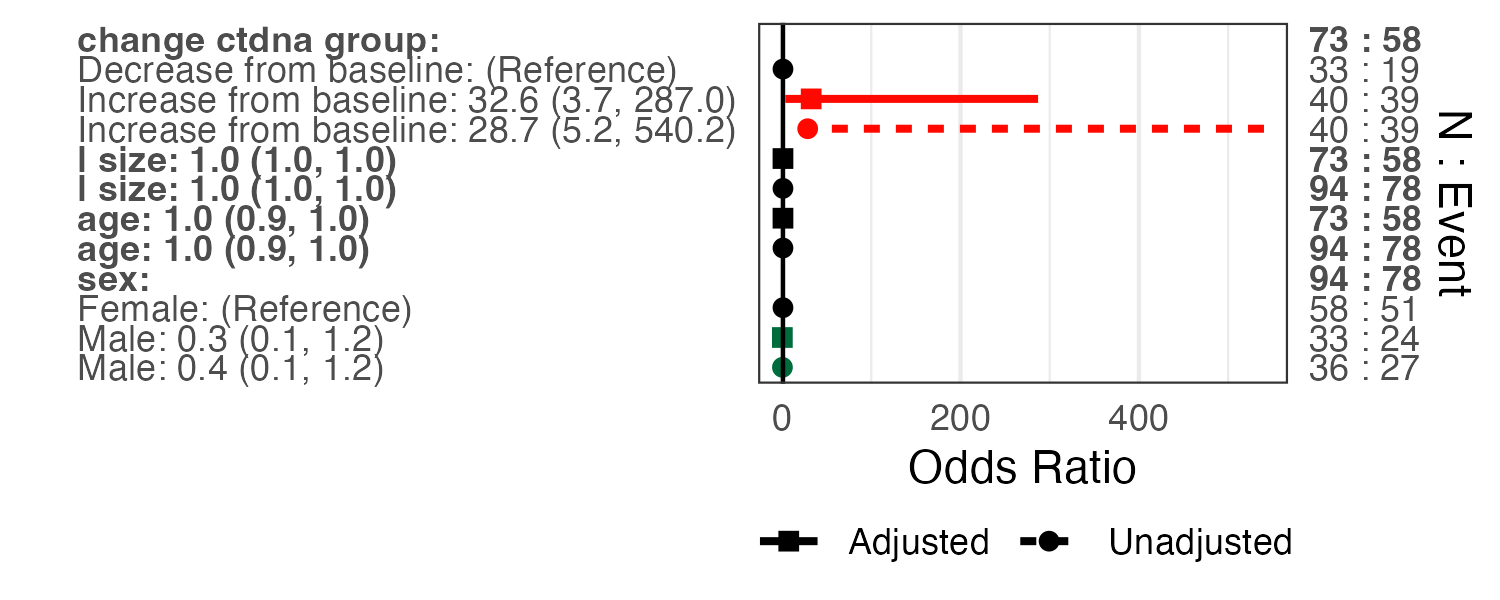
This can also be done with linear scale odds ratios. Number of subjects and/or number of events can also be turned off, as well as different colours used.
uvFP <- forestplotUV(data=pembrolizumab, response='orr',
covs=c('age','sex','pdl1','change_ctdna_group'))

glm_fit <- glm(orr~change_ctdna_group+pdl1,
               family='binomial',
               data = pembrolizumab)
mvFP <- forestplotMV(glm_fit)

forestplotUVMV(uvFP,mvFP,showN=F,showEvent=F,colours=c("orange","black","blue"),logScale=F)