2.11 References
The popular bookdown package has word and pdf output formats that enable easier cross-referencing. ReportRx will produce tables that are properly formatted in all output formats. You can learn more about bookdown here
To reference a figure, the chunk needs a name, and for fig.caption to be set and can be referenced using \@ref(fig:speed-plot) where speed-plot is the name of the chunk containing the figure.
Example: Figure 2.1 is an example of a boxplot.
{r speed-plot,fig.cap='Speed and distance.',fig.height=2.5}
data(cars)
plot(x=cars$dist,y=cars$speed)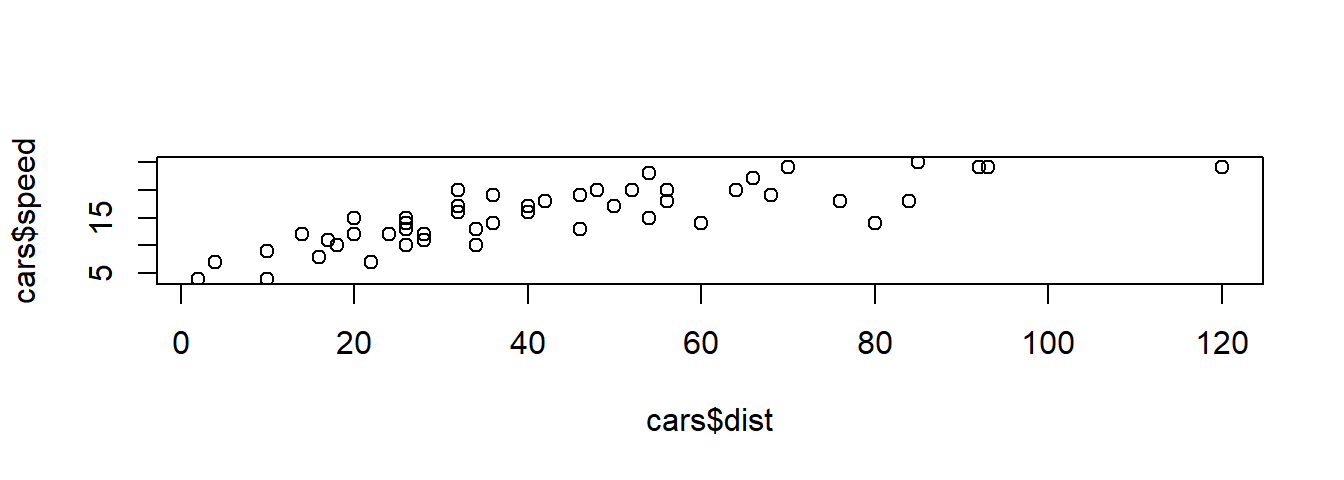
Figure 2.1: Speed and distance.
To reference tables is a similar, use \@ref(tab:speed-tab). If outputting to Word, chunk_label needs to be specified as an argument. For HTML/PDF this can be omitted. Hopefully this will be automated for Word one day.
Example: Table 2.1 is an example of a table.
{r speed-tab}
rm_covsum(data=cars,covs = c('speed','dist'),
          chunk_label = 'speed-tab')
| Covariate | n=50 |
|---|---|
| speed | |
| Mean (sd) | 15.4 (5.3) |
| Median (Min,Max) | 15 (4,25) |
| dist | |
| Mean (sd) | 43.0 (25.8) |
| Median (Min,Max) | 36 (2,120) |