3.8 plotuv
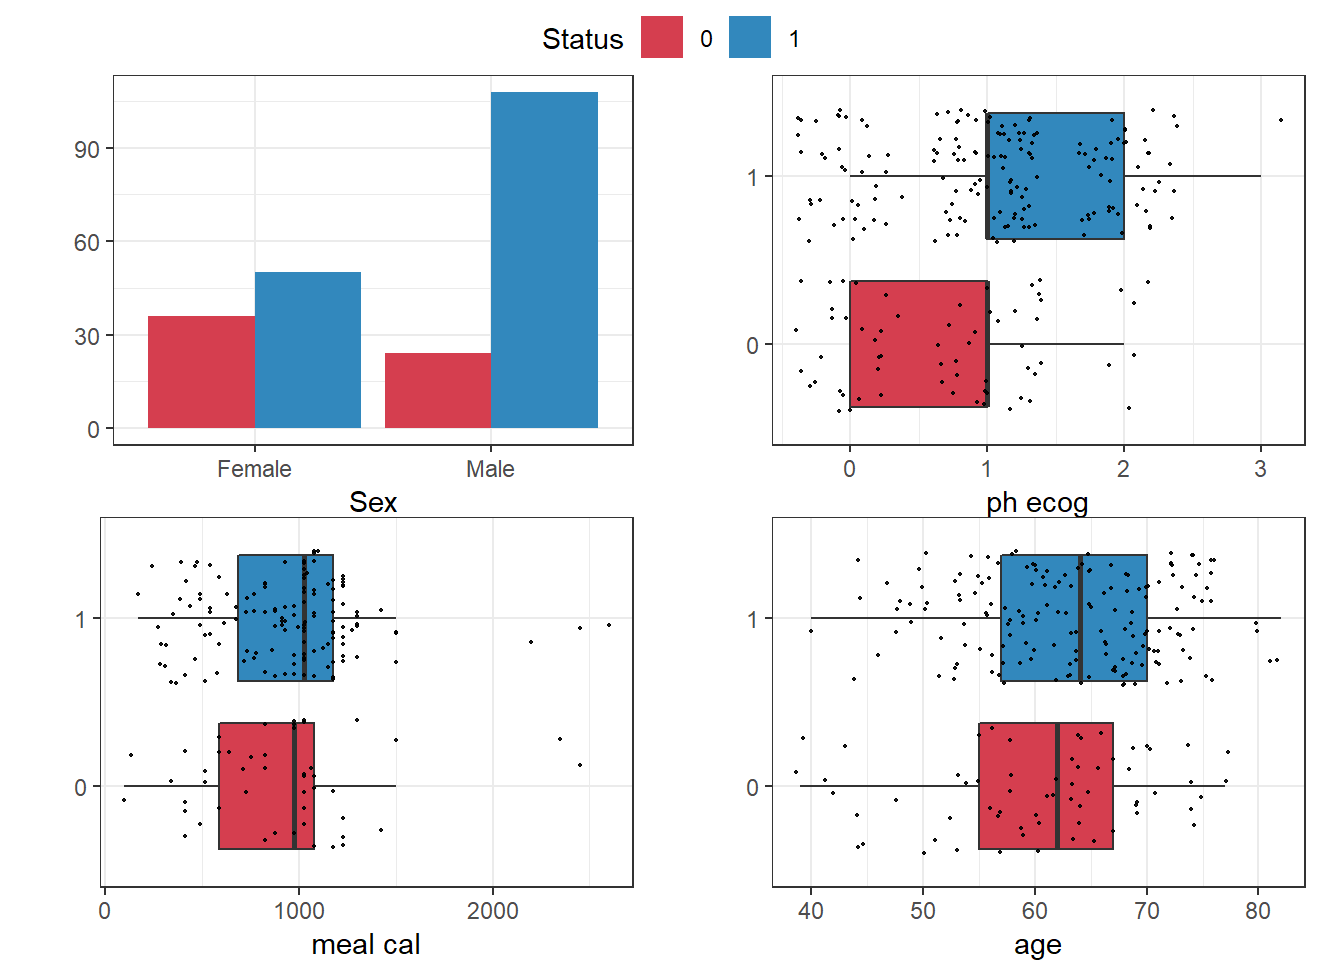
Designed to be a visualisation of uvsum with arguments supplied in the same manner. This goal is not publication-ready plots but rather a quick means of displaying the data to facilitate the interpretation of the uvsum output from.
plotuv(response = 'Status',
                covs=c('Sex','ph.ecog','meal.cal','age'),
                data=lung)