3.7 ggkmcif
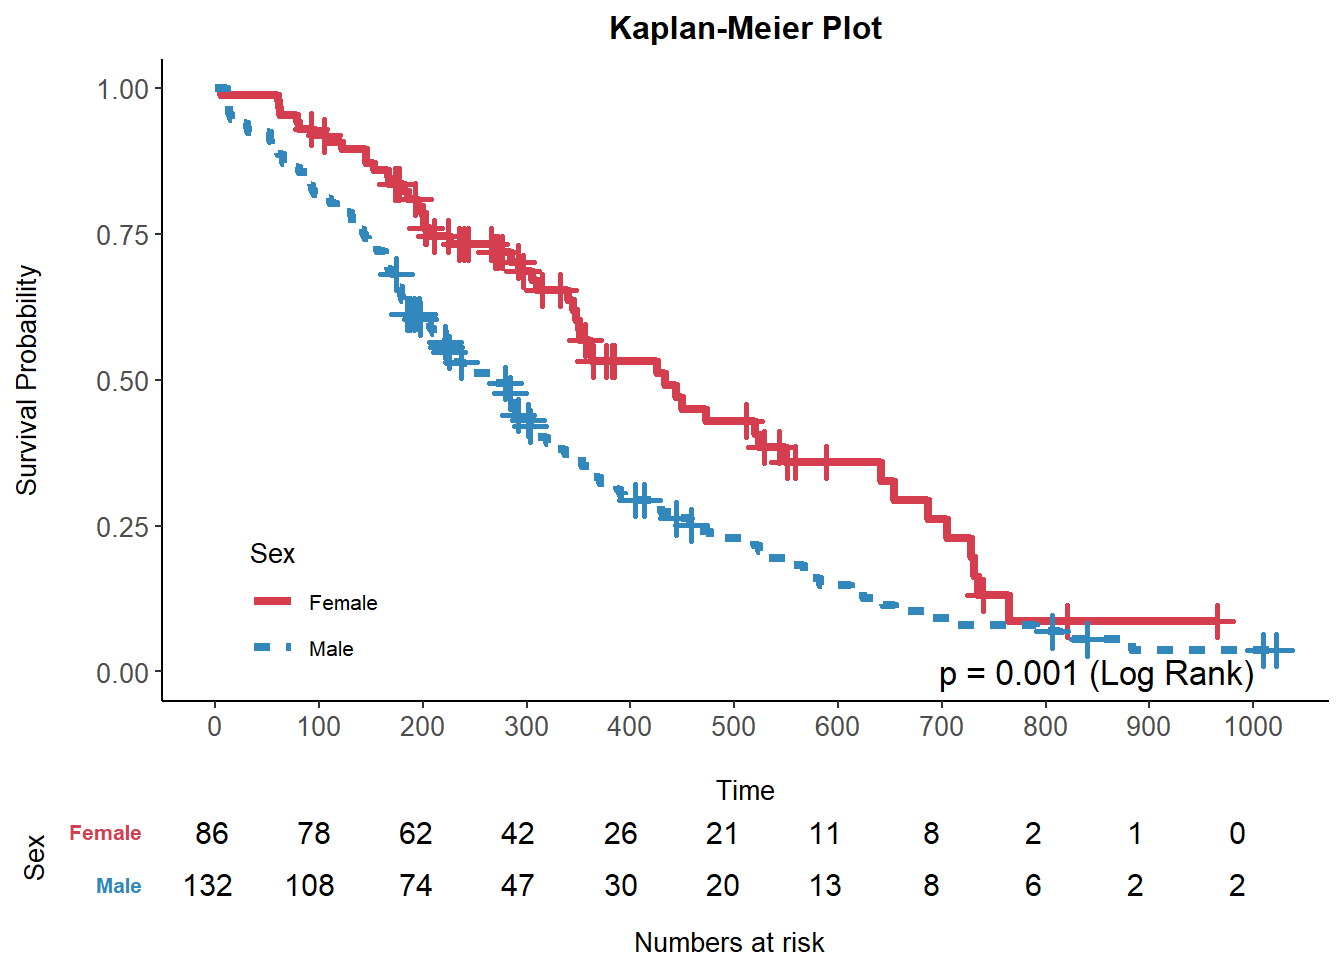
Plot KM and CI curves using ggplot2 with the usual reportRx arguments and a lot of options for customisation for publication-ready plots.
ggkmcif(c("time","status"),"Sex", data=lung,fsize=10,nsize=4)## [1] "10 observations have been removed due to missing data"