3.9 forestplot2
This will produce a forest plot of OR or RR from an object derived from glm. The risks are plotted on a log-scale, ordered from highest to lowest.
fit = glm(Status~age+Sex+wt.loss+ph.karno+ph.ecog+pat.karno+meal.cal,
          family='binomial',
          data=lung)
forestplot2(fit, rmRef=T)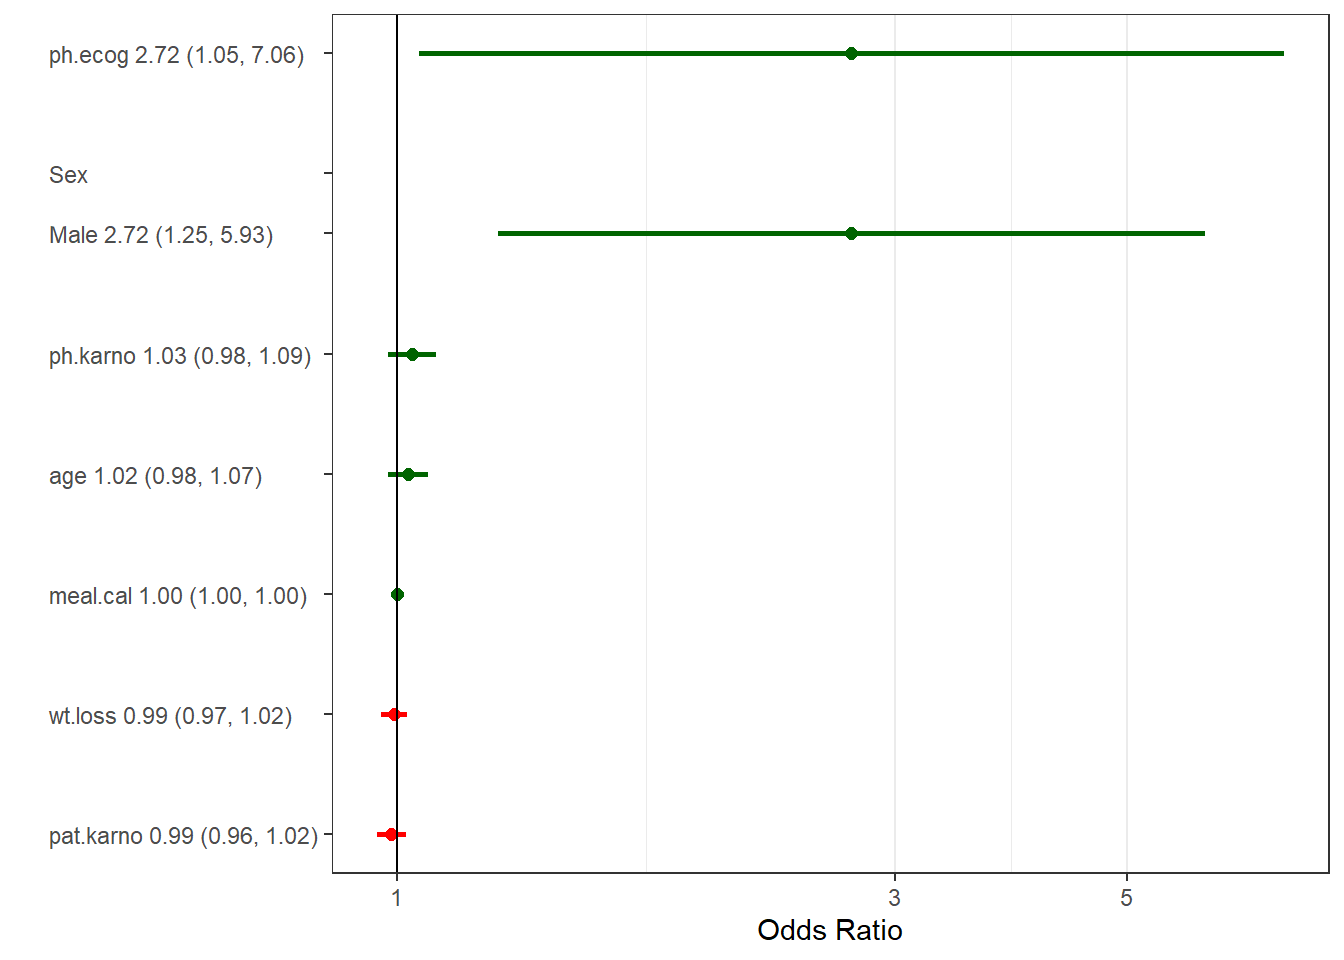
(Note: There is an existing forestplot function, which is why this one is named forestplot2)