reportRmd
PMH Biostatistics
1
Overview
2
Summary statistics
2.1
Summaries By Group
2.2
Showing Statistical Tests
2.3
Including Effect Sizes
2.4
Parametric vs Non-parametric Comparisons
2.5
Row vs Column Summaries
3
Univariate regression
3.1
Simple Linear Regression
3.2
Logistic Regression
3.3
Poisson Regression
3.4
Survival Analysis
3.5
Competing Risk
3.6
GEE Models
3.7
Returning Model Objects
3.8
Adjusting p-values
4
Multivariable analysis
5
Combining univariate and multivariable models
6
Changing the output
7
Combining tables
8
Simple Survival Summaries
9
Survival Times in Long Format
9.1
Survival Times With Covariate Adjustments
10
Stratified Survival Summary
11
Plotting Functions
11.1
Plotting bivariate relationships
11.2
Plotting odds ratios
11.3
Plotting survival curves
12
PDF Output
13
Data Sets
13.0.1
pembrolizumab
13.0.2
ctDNA
reportRmd Package
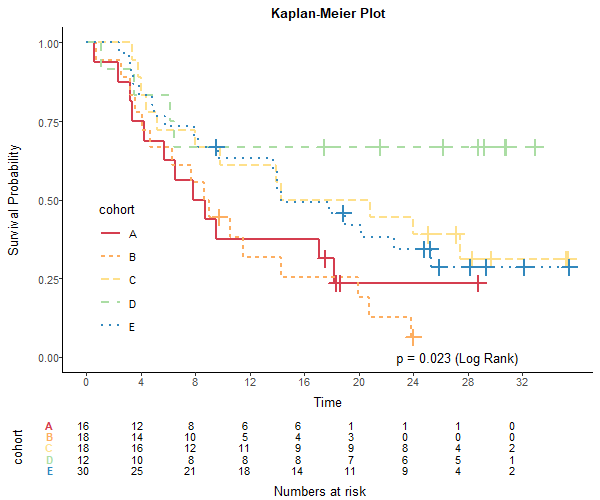
11.3
Plotting survival curves
ggkmcif
(
response =
c
(
'os_time'
,
'os_status'
),
cov=
'cohort'
,
data=
pembrolizumab)