Plotting bivariate relationships
These plots are designed for quick inspection of many variables, not for publication. This is the plotting version of rm_uvsum
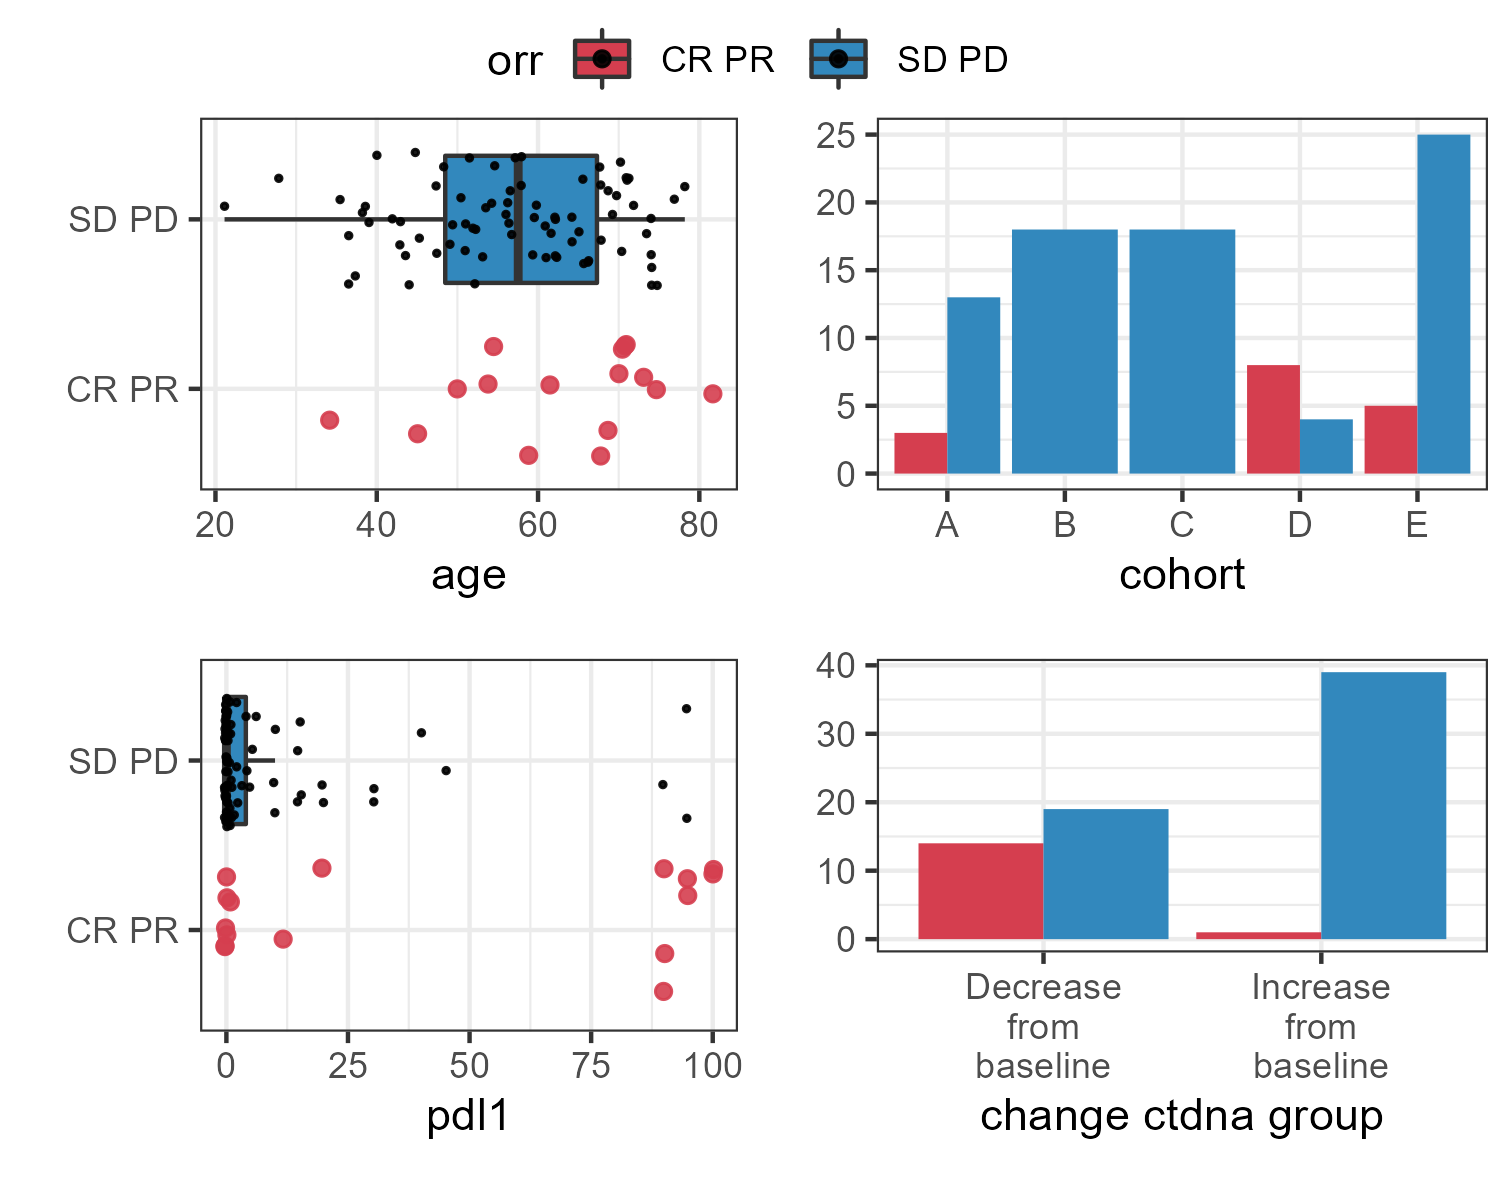
plotuv(data=pembrolizumab, response='orr',
covs=c('age','cohort','pdl1','change_ctdna_group'))