This will default to a log scale, but can be set to linear using logscale=FALSE
logscale=FALSE
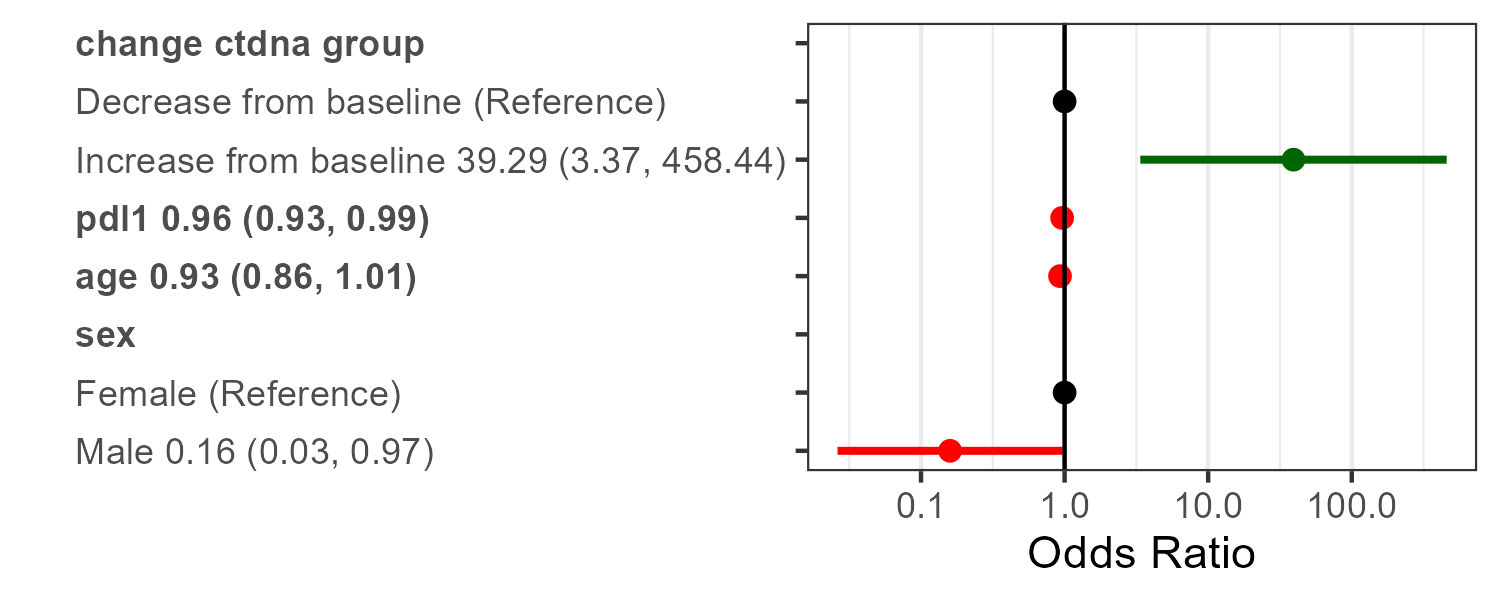
require(ggplot2)
glm_fit <- glm(orr~age+sex+change_ctdna_group+pdl1,
               family='binomial',
               data = pembrolizumab)
forestplot2(glm_fit)