4 Formatting data
For all of the function to run, the data must be in the long format. This means that each event must be on a new row. An event would be a single point, a line segment, or an arrow. If a study unit has multiple events occur they must be recorded over multiple rows. Often times data is given in the long format (eg. One row per patient).
4.1 Long data
Here is an example data.frame in the long format.
wide_example <- structure(list(ID = c("ID:001", "ID:002", "ID:003"), Date.begin.Treatment = structure(c(14307,
14126, 15312), class = "Date"), AE = structure(c(16133, 14491,
NA), class = "Date"), SAE = structure(c(16316, NA, 16042), class = "Date"),
    Death.date = structure(c(16499, NA, 17869), class = "Date"),
    Response1 = c("SD", "SD", NA), Response1.Start = structure(c(14745,
    14345, NA), class = "Date"), Response1.End = structure(c(15111,
    14418, NA), class = "Date"), Response2 = c("CR", "PR", NA
    ), Response2.Start = structure(c(15768, 14674, NA), class = "Date"),
    Response2.End = structure(c(16133, 14856, NA), class = "Date"),
    Response3 = c(NA, "CR", NA), Response3.Start = structure(c(NA,
    14856, NA), class = "Date"), Response3.End = structure(c(NA,
    15587, NA), class = "Date"), Last.follow.up = structure(c(16499,
    17048, 17869), class = "Date")), class = "data.frame", row.names = c(NA,
-3L))| ID | Date.begin.Treatment | AE | SAE | Death.date | Response1 | Response1.Start | Response1.End | Response2 | Response2.Start | Response2.End | Response3 | Response3.Start | Response3.End | Last.follow.up |
|---|---|---|---|---|---|---|---|---|---|---|---|---|---|---|
| ID:001 | 2009-03-04 | 2014-03-04 | 2014-09-03 | 2015-03-05 | SD | 2010-05-16 | 2011-05-17 | CR | 2013-03-04 | 2014-03-04 | NA | NA | NA | 2015-03-05 |
| ID:002 | 2008-09-04 | 2009-09-04 | NA | NA | SD | 2009-04-11 | 2009-06-23 | PR | 2010-03-06 | 2010-09-04 | CR | 2010-09-04 | 2012-09-04 | 2016-09-04 |
| ID:003 | 2011-12-04 | NA | 2013-12-03 | 2018-12-04 | NA | NA | NA | NA | NA | NA | NA | NA | NA | 2018-12-04 |
All of the dates need to be converted to time. For each patient the Date.begin.Treatment is the starting point (Time 0)
date_cols <- c("Date.begin.Treatment","AE","SAE",'Death.date','Response1.Start', 'Response1.End','Response2.Start', 'Response2.End',
               'Response3.Start' ,'Response3.End' ,'Last.follow.up') # Getting the columns with dates
wide_example[date_cols] <- lapply(wide_example[date_cols], as.numeric) # Converting to numbers
wide_example[date_cols] <- round((wide_example[date_cols]-wide_example$Date.begin.Treatment)/365.25,1) #Calcuating the time in years since the start of treatment
knitr::kable(wide_example)| ID | Date.begin.Treatment | AE | SAE | Death.date | Response1 | Response1.Start | Response1.End | Response2 | Response2.Start | Response2.End | Response3 | Response3.Start | Response3.End | Last.follow.up |
|---|---|---|---|---|---|---|---|---|---|---|---|---|---|---|
| ID:001 | 0 | 5 | 5.5 | 6 | SD | 1.2 | 2.2 | CR | 4.0 | 5 | NA | NA | NA | 6 |
| ID:002 | 0 | 1 | NA | NA | SD | 0.6 | 0.8 | PR | 1.5 | 2 | CR | 2 | 4 | 8 |
| ID:003 | 0 | NA | 2.0 | 7 | NA | NA | NA | NA | NA | NA | NA | NA | NA | 7 |
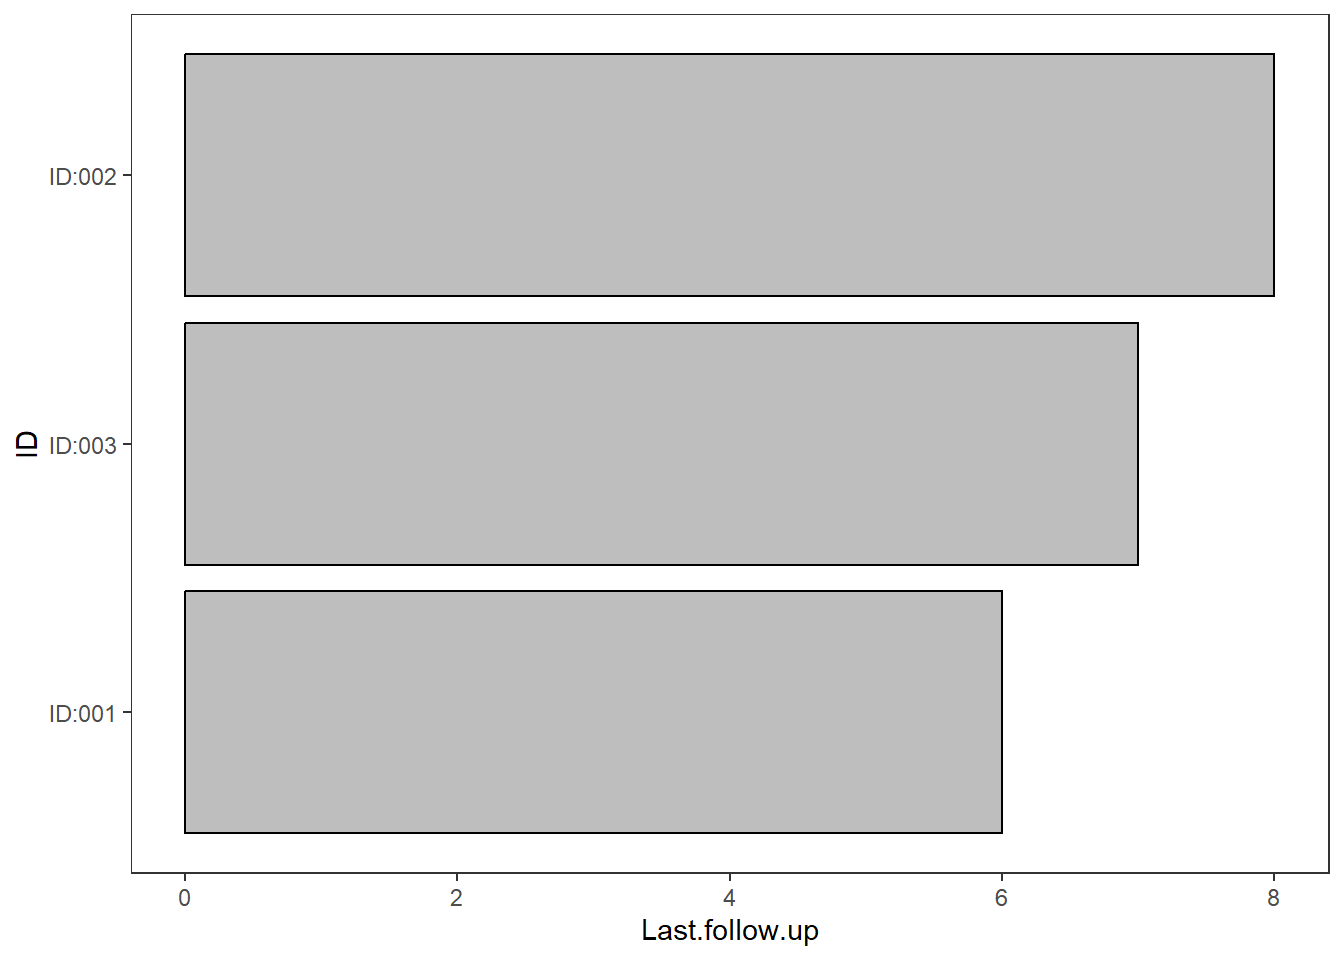
The wide data can be used to create the bars of the swimmer plot
plot <- swimmer_plot(df=wide_example,id='ID',end='Last.follow.up',col='black',fill='grey')
plot