3.2 Logistic model
Examine the bivariate relationship first among variables to high protein status of milk. Check for quasi or complete separation of categories. Shout out to Lisa Avery for this function!
plotuv(data=Milk, response='High_Protein', covs=c('Cow', 'Yard', 'Diet', 'Time', 'protein'));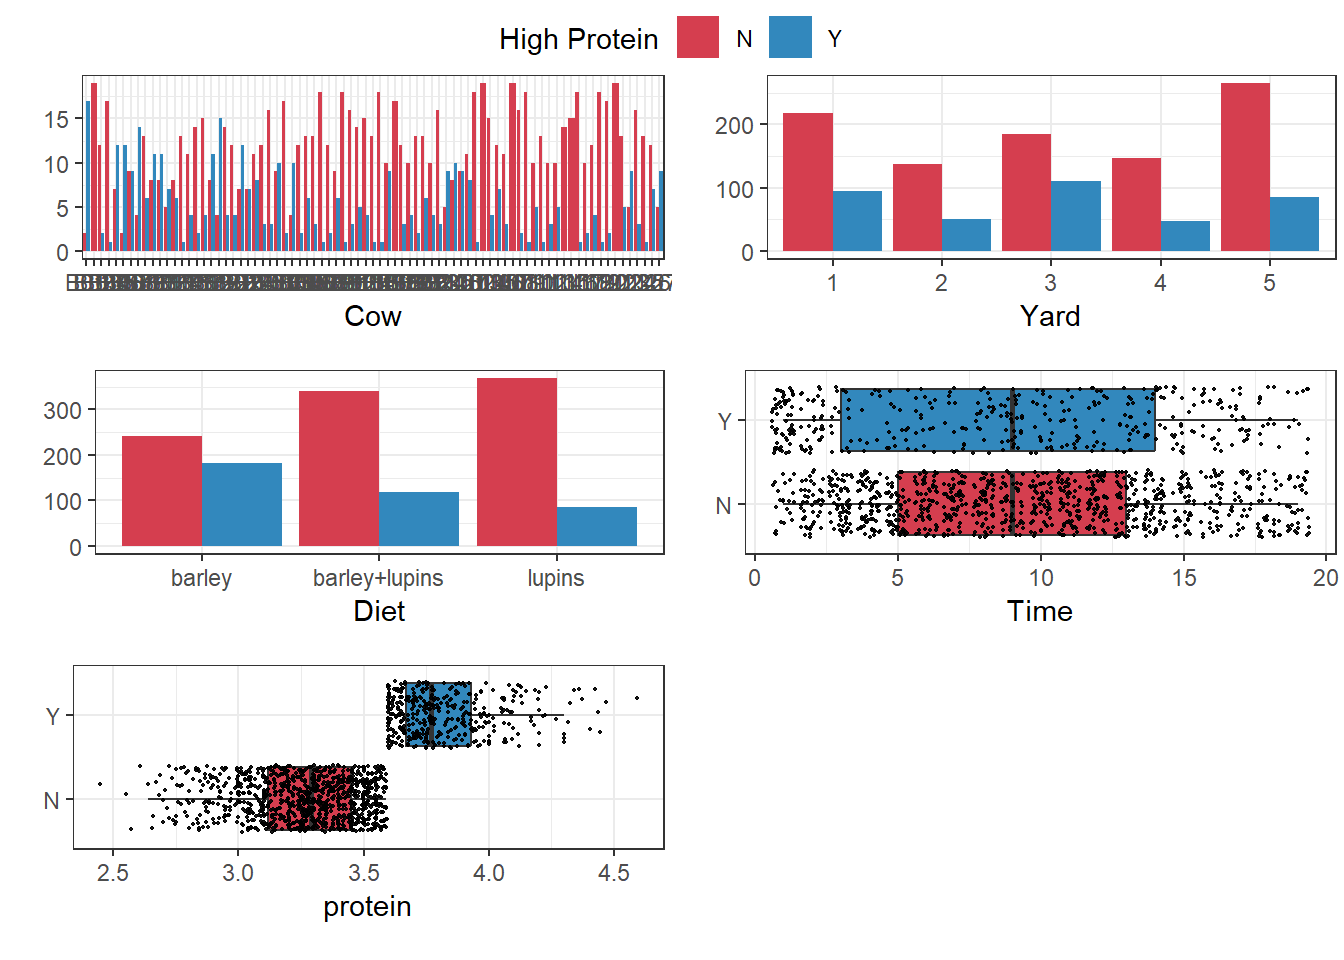
Below logistic model does not account for clustering of repeat observations by cow to high protein status of milk.
rm_mvsum(model=glm(High_Protein ~ Diet + Yard + Time, data=Milk, family='binomial'), showN=T, vif=T);| OR(95%CI) | p-value | N | Event | VIF | |
|---|---|---|---|---|---|
| Diet | 1337 | 386 | 1.03 | ||
| barley | Reference | 425 | 183 | ||
| barley+lupins | 0.41 (0.31, 0.55) | <0.001 | 459 | 119 | |
| lupins | 0.29 (0.21, 0.40) | <0.001 | 453 | 84 | |
| Yard | 1337 | 386 | 1.01 | ||
| 1 | Reference | 193 | 56 | ||
| 2 | 1.11 (0.73, 1.71) | 0.62 | 244 | 84 | |
| 3 | 0.80 (0.52, 1.25) | 0.33 | 222 | 71 | |
| 4 | 0.54 (0.36, 0.83) | 0.004 | 346 | 76 | |
| 5 | 0.83 (0.55, 1.25) | 0.36 | 332 | 99 | |
| Time | 0.97 (0.95, 1.00) | 0.020 | 1337 | 386 | 1.00 |