Plot KM and CIF curves with ggplot
ggkmcif2_2025.RdThis function will plot a KM or CIF curve with option to add the number at risk. You can specify if you want confidence bands, the hazard ratio, and pvalues, as well as the units of time used.
Arguments
- response
character vector with names of columns to use for response
- cov
String specifying the column name of stratification variable
- data
dataframe containing your data
- pval
boolean to specify if you want p-values in the plot (Log Rank test for KM and Gray's test for CIF)
- conf.curves
boolean to specify if you want confidence interval bands
- table
Logical value. If TRUE, includes the number at risk table
- xlab
String corresponding to xlabel. By default is "Time"
- ylab
String corresponding to ylabel. When NULL uses "Survival
- col
vector of colours
- times
Numeric vector of times for the x-axis probability" for KM cuves, and "Probability of an event" for CIF
- type
string indicating he type of univariate model to fit. The function will try and guess what type you want based on your response. If you want to override this you can manually specify the type. Options include "KM", and ,"CIF"
- plot.event
Which event(s) to plot (1,2, or c(1,2))
- returns
boolean indicating if a list with the objects should be returned. Default is FALSE and plot will be printed
- ...
for additional plotting arguments see ggkmcif2Parameters_2025
Value
ggplot object; if table = F then only curves are output; if table = T then curves and risk table are output together
Details
Note that for proper pdf output of special characters the following code needs to be included in the first chunk of the rmd knitr::opts_chunk$set(dev="cairo_pdf")
Examples
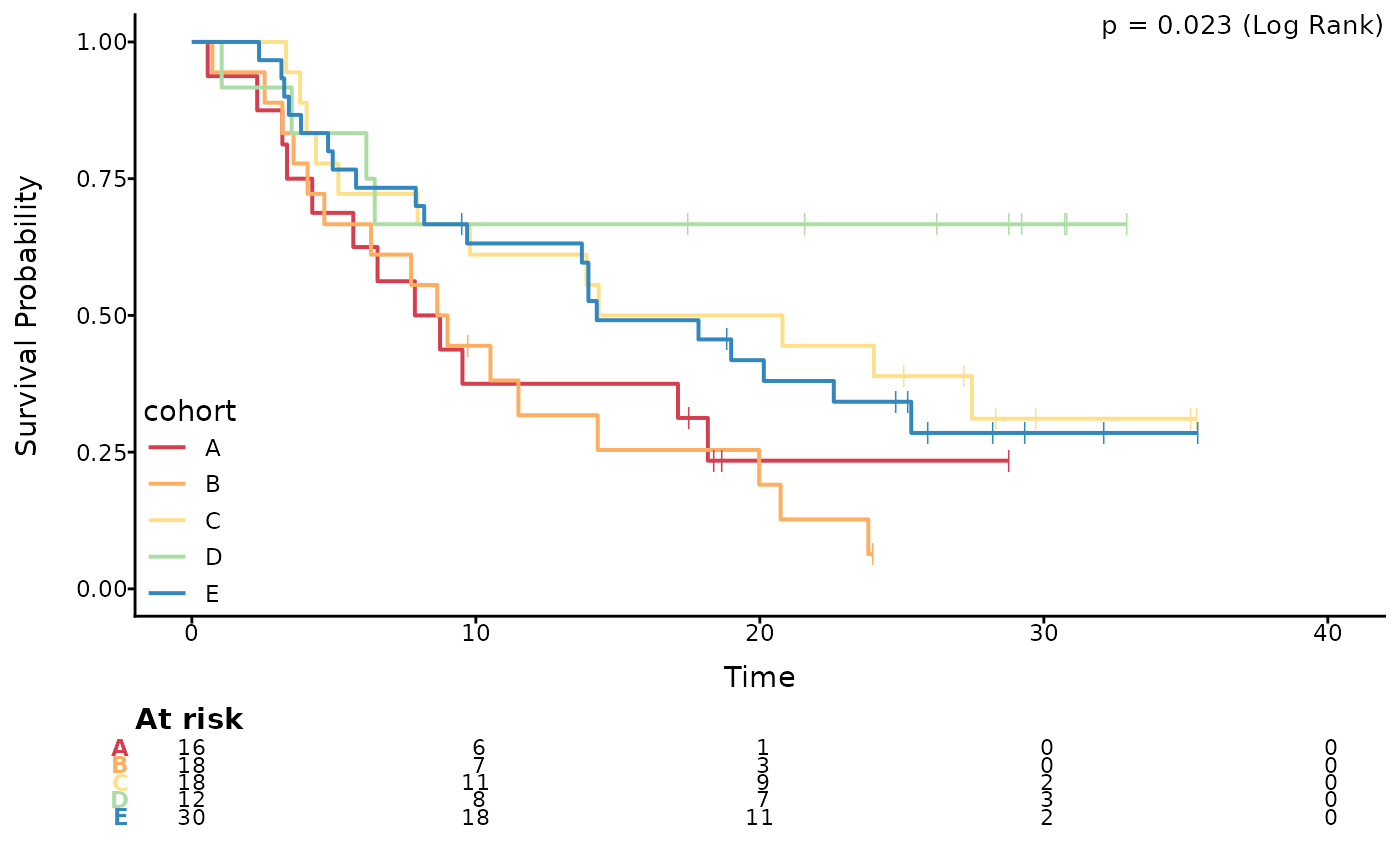
# Simple plot without confidence intervals
data("pembrolizumab")
ggkmcif2(response = c('os_time','os_status'),
cov='cohort',
data=pembrolizumab)
#> Warning: Vectorized input to `element_text()` is not officially supported.
#> ℹ Results may be unexpected or may change in future versions of ggplot2.
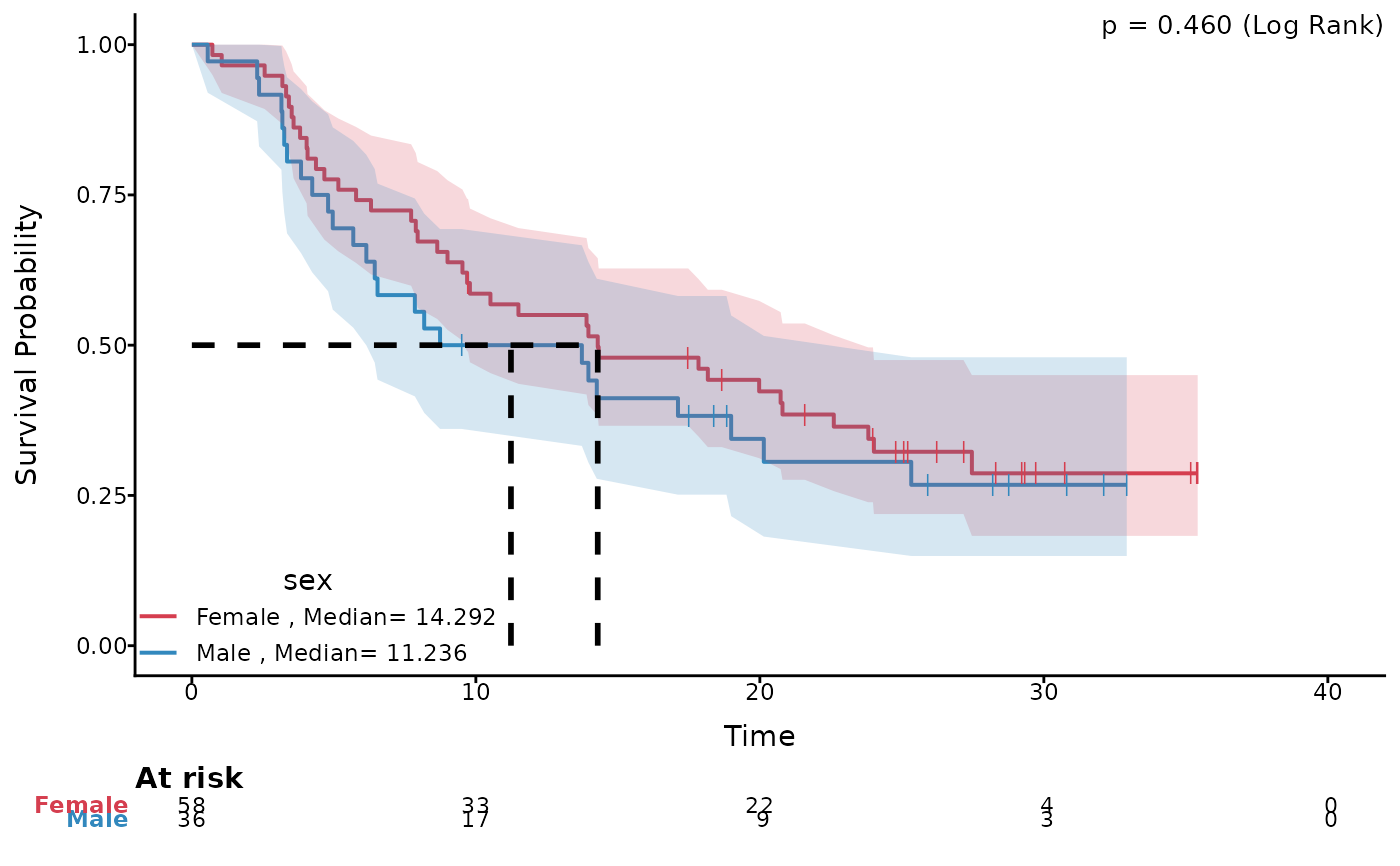
 # Plot with median survival time
ggkmcif2(response = c('os_time','os_status'),
cov='sex',
data=pembrolizumab,
median.text = TRUE,median.lines=TRUE,conf.curves=TRUE)
#> Warning: Vectorized input to `element_text()` is not officially supported.
#> ℹ Results may be unexpected or may change in future versions of ggplot2.
# Plot with median survival time
ggkmcif2(response = c('os_time','os_status'),
cov='sex',
data=pembrolizumab,
median.text = TRUE,median.lines=TRUE,conf.curves=TRUE)
#> Warning: Vectorized input to `element_text()` is not officially supported.
#> ℹ Results may be unexpected or may change in future versions of ggplot2.
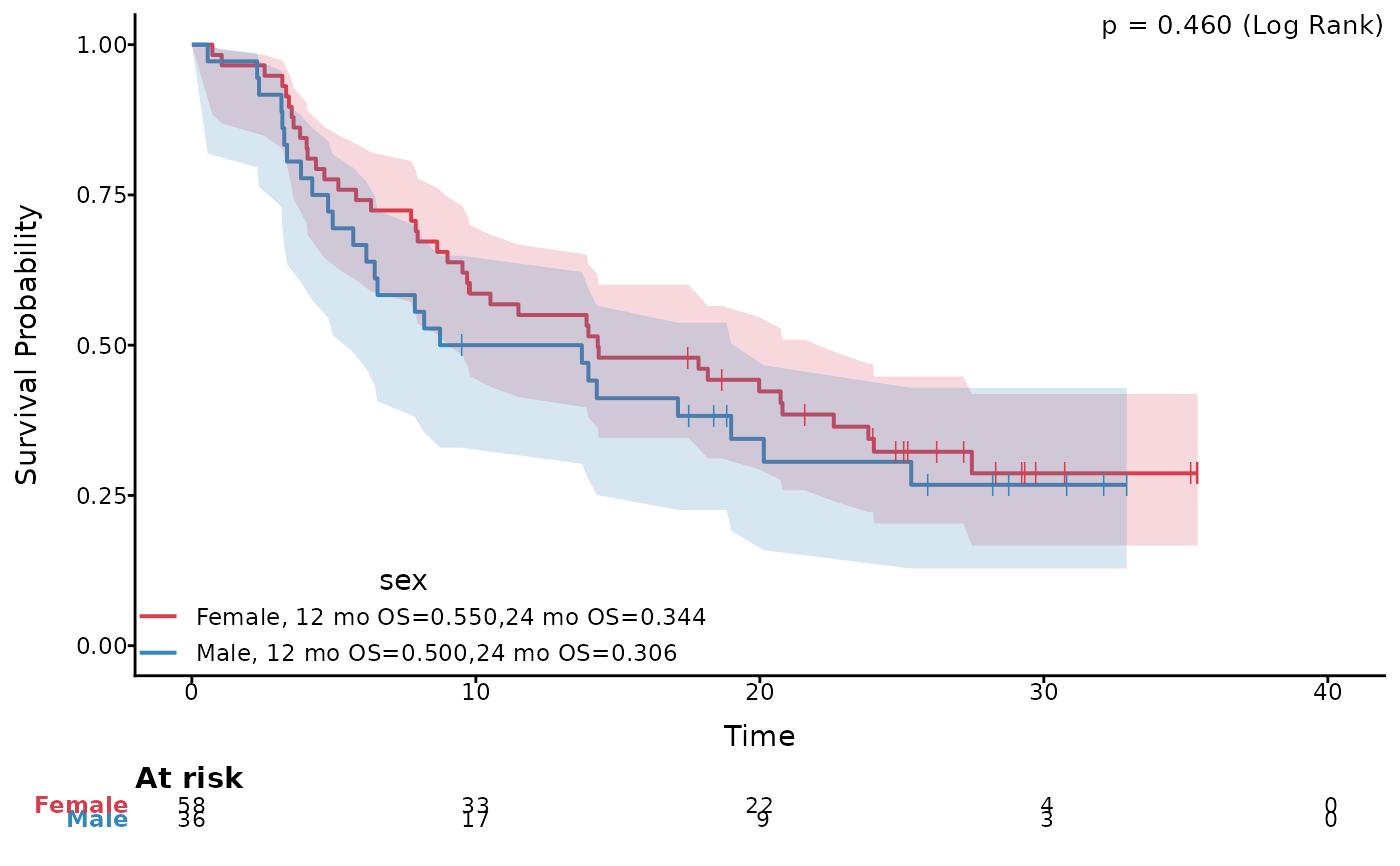
 # Plot with specified survival times and log-log CI
ggkmcif2(response = c('os_time','os_status'),
cov='sex',
data=pembrolizumab,
median.text = FALSE,set.time.text = 'mo OS',
set.time = c(12,24),conf.type = 'log-log',conf.curves=TRUE)
#> Warning: Vectorized input to `element_text()` is not officially supported.
#> ℹ Results may be unexpected or may change in future versions of ggplot2.
# Plot with specified survival times and log-log CI
ggkmcif2(response = c('os_time','os_status'),
cov='sex',
data=pembrolizumab,
median.text = FALSE,set.time.text = 'mo OS',
set.time = c(12,24),conf.type = 'log-log',conf.curves=TRUE)
#> Warning: Vectorized input to `element_text()` is not officially supported.
#> ℹ Results may be unexpected or may change in future versions of ggplot2.
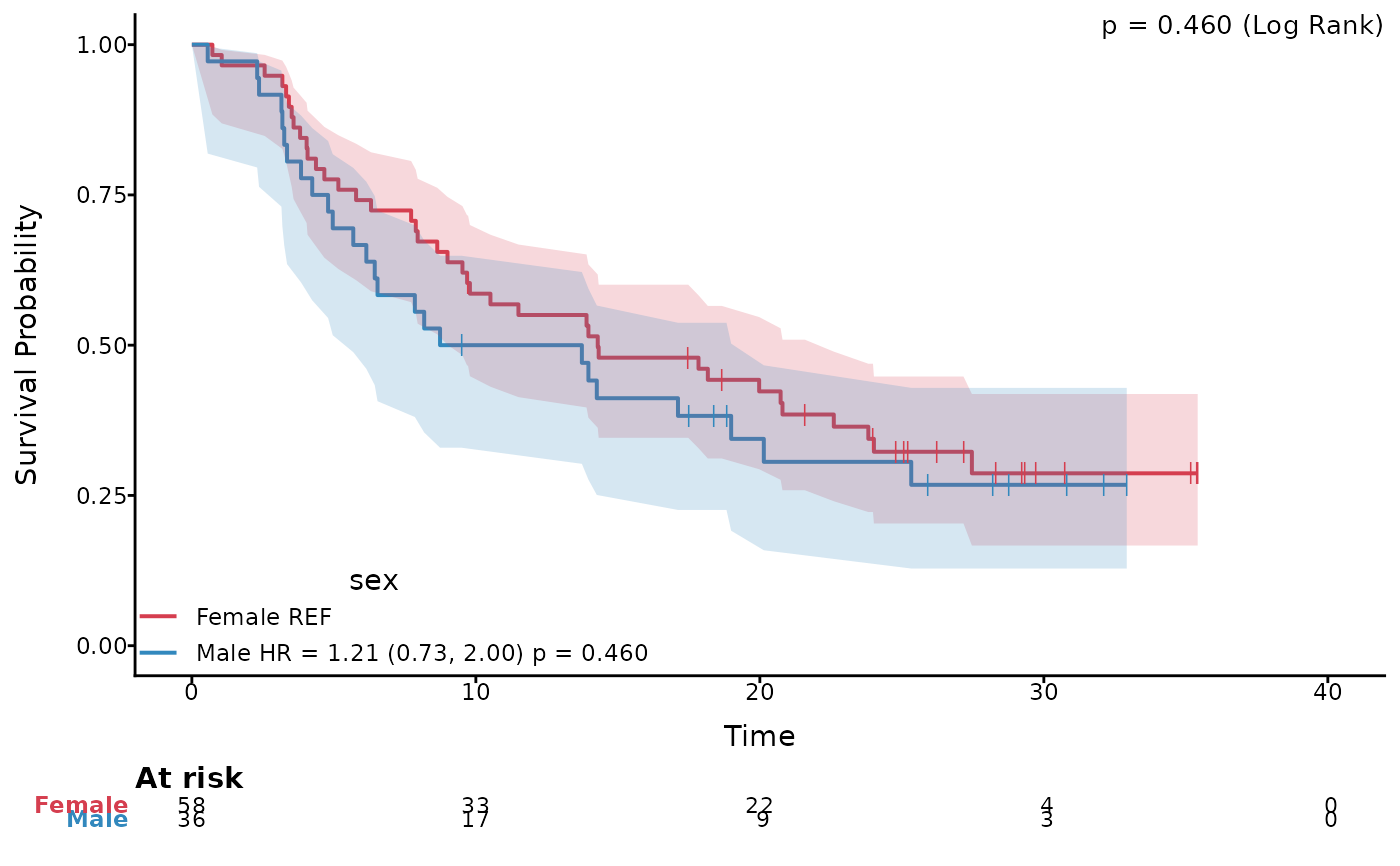
 # KM plot with 95% CI and censor marks
ggkmcif2(c('os_time','os_status'),'sex',data = pembrolizumab, type = 'KM',
HR=TRUE, HR_pval = TRUE, conf.curves = TRUE,conf.type='log-log',
set.time.CI = TRUE, censor.marks=TRUE)
#> Warning: Vectorized input to `element_text()` is not officially supported.
#> ℹ Results may be unexpected or may change in future versions of ggplot2.
# KM plot with 95% CI and censor marks
ggkmcif2(c('os_time','os_status'),'sex',data = pembrolizumab, type = 'KM',
HR=TRUE, HR_pval = TRUE, conf.curves = TRUE,conf.type='log-log',
set.time.CI = TRUE, censor.marks=TRUE)
#> Warning: Vectorized input to `element_text()` is not officially supported.
#> ℹ Results may be unexpected or may change in future versions of ggplot2.