Create a univariable forest plot using ggplot2
forestplotUV.RdThis function creates forest plots from univariable regression models. For new code, consider using forestplotMV() which can handle both adjusted and unadjusted estimates.
forestplotUV(
  response,
  covs,
  data,
  model = "glm",
  id = NULL,
  corstr = NULL,
  family = NULL,
  digits = getOption("reportRmd.digits", 2),
  conf.level = 0.95,
  colours = "default",
  showEst = TRUE,
  showRef = TRUE,
  logScale = getOption("reportRmd.logScale", TRUE),
  nxTicks = 5,
  showN = TRUE,
  showEvent = TRUE,
  xlim = NULL
)
Arguments
- response
character vector with names of columns to use for response
- covs
character vector with names of columns to use for covariates
- data
dataframe containing your data
- model
fitted model object (default "glm")
- id
character vector which identifies clusters. Only used for geeglm
- corstr
character string specifying the correlation structure. Only used for geeglm
- family
description of the error distribution and link function to be used in the model
- digits
number of digits to round to (default 2)
- conf.level
controls the width of the confidence interval (default 0.95)
- colours
can specify colours for risks less than, equal to, and greater than 1.0. Default is green, black, red
- showEst
logical, should the risks be displayed on the plot in text? Default is TRUE
- showRef
logical, should reference levels be shown? Default is TRUE
- logScale
logical, should OR/RR be shown on log scale? Defaults to TRUE
- nxTicks
Number of tick marks for x-axis (default 5)
- showN
Show number of observations per variable and category (default TRUE)
- showEvent
Show number of events per variable and category (default TRUE)
- xlim
numeric vector of length 2 specifying x-axis limits (ex c(0.2, 5)) Confidence intervals extending beyond these limits will be shown with arrows.
Value
a ggplot object
Examples
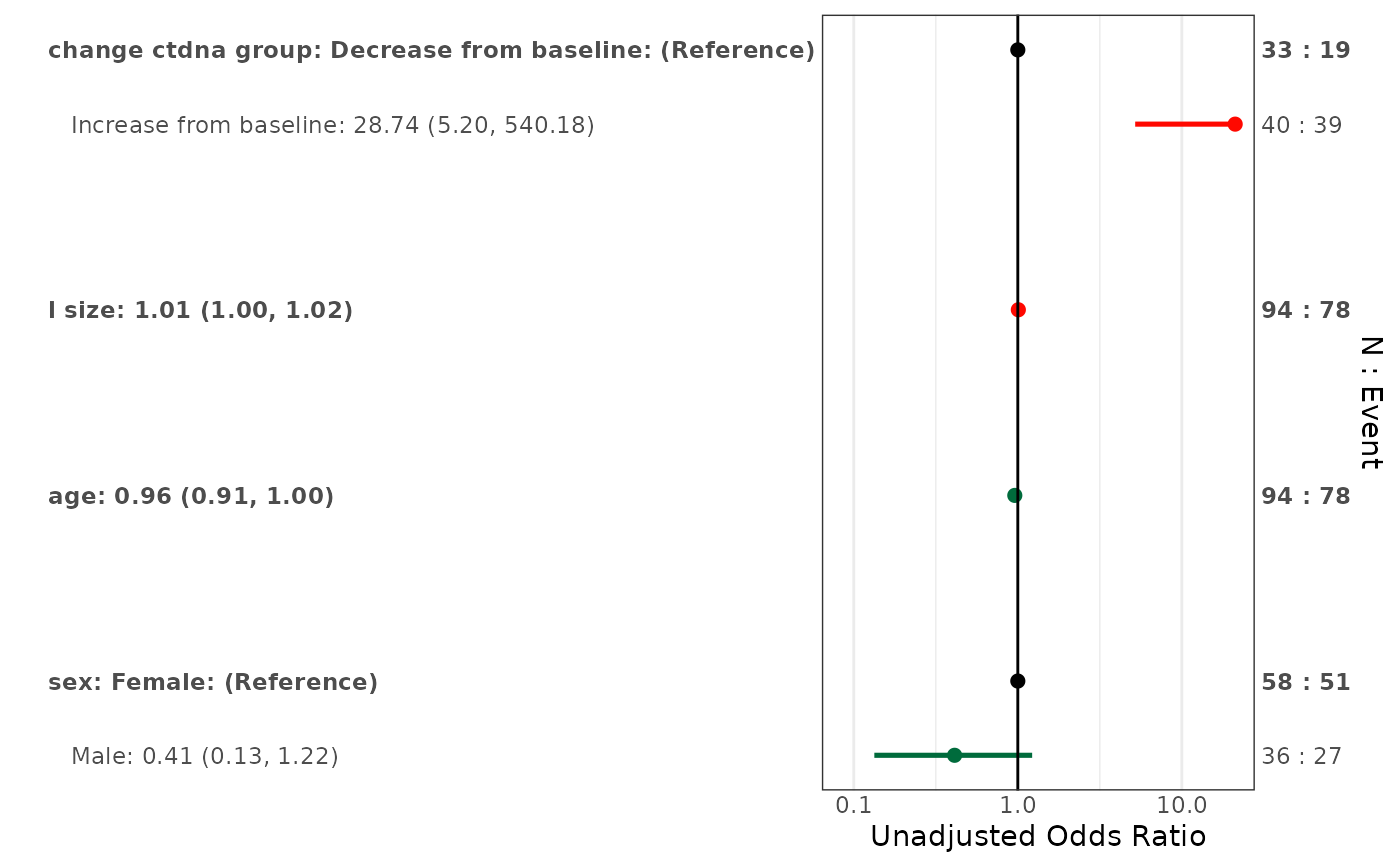
data("pembrolizumab")
forestplotUV(response = "orr",
             covs = c("change_ctdna_group", "sex", "age", "l_size"),
             data = pembrolizumab, family = 'binomial')
#> Warning: Vectorized input to `element_text()` is not officially supported.
#> ℹ Results may be unexpected or may change in future versions of ggplot2.
#> Note: Very wide confidence intervals detected. X-axis capped for readability.
#> `height` was translated to `width`.