Create a multivariable forest plot using ggplot2
forestplotMV.RdThis function creates forest plots from fitted regression models, with optional inclusion of unadjusted estimates. It uses m_summary for robust data extraction and properly handles factor level ordering and reference levels.
Arguments
- model
an object output from the glm or geeglm function, must be from a logistic or log-link regression
- data
dataframe containing your data (required if include_unadjusted = TRUE)
- include_unadjusted
logical, should unadjusted estimates be included? Default is FALSE
- conf.level
controls the width of the confidence interval (default 0.95)
- colours
can specify colours for risks less than, equal to, and greater than 1.0. Default is green, black, red
- showEst
logical, should the risks be displayed on the plot in text? Default is TRUE
- showRef
logical, should reference levels be shown? Default is TRUE
- digits
number of digits to use displaying estimates (default 2)
- logScale
logical, should OR/RR be shown on log scale? Defaults to TRUE. See https://doi.org/10.1093/aje/kwr156 for why you may prefer a linear scale
- nxTicks
Number of tick marks for x-axis (default 5)
- showN
Show number of observations per variable and category (default TRUE)
- showEvent
Show number of events per variable and category (default TRUE)
- xlim
Numeric vector of length 2 specifying x-axis limits (ex c(0.2, 5))
Value
a ggplot object
Examples
data("pembrolizumab")
glm_fit <- glm(orr ~ change_ctdna_group + sex + age + l_size,
data = pembrolizumab, family = 'binomial')
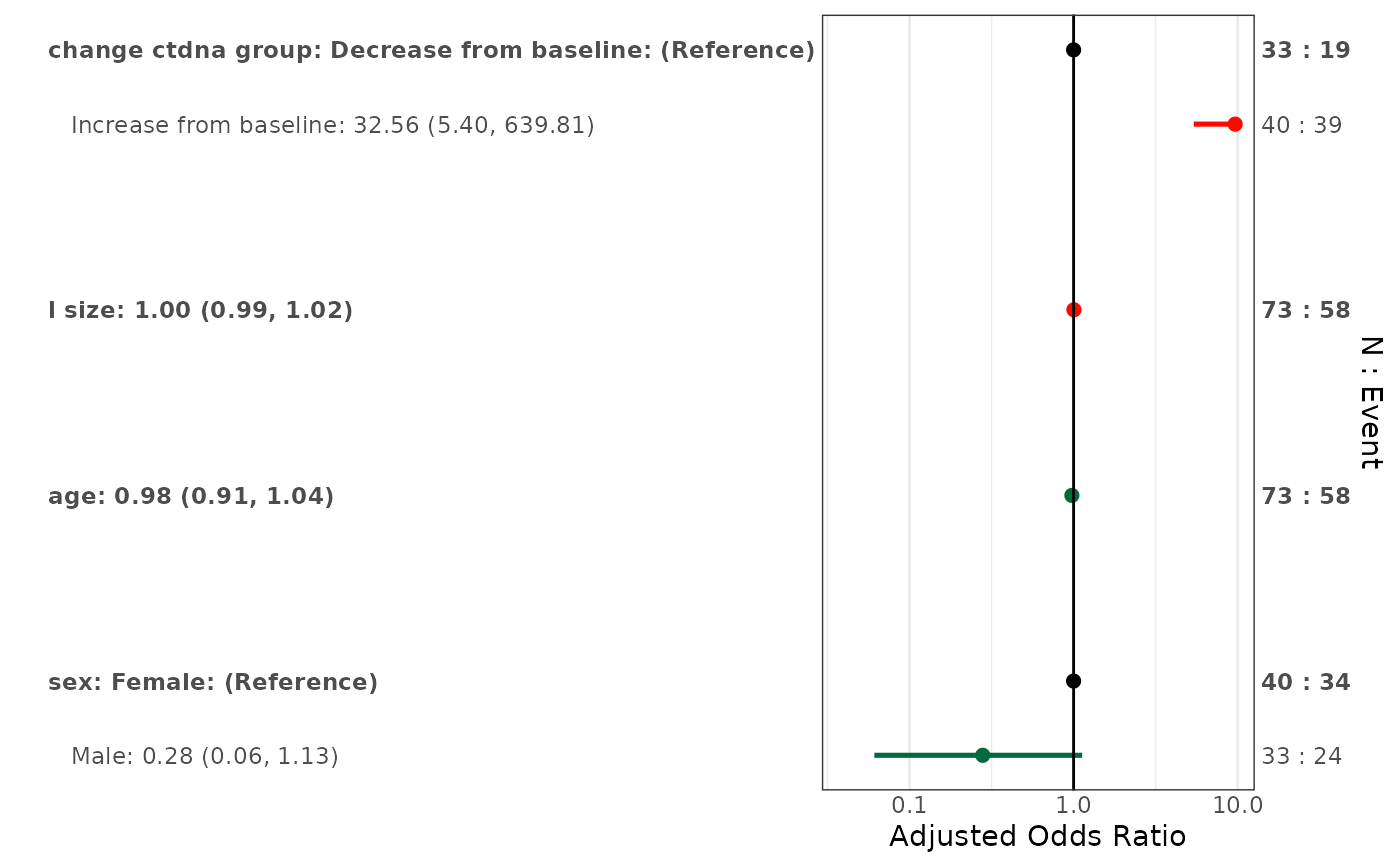
# Adjusted only
forestplotMV(glm_fit, data = pembrolizumab)
#> Warning: Using `size` aesthetic for lines was deprecated in ggplot2 3.4.0.
#> ℹ Please use `linewidth` instead.
#> ℹ The deprecated feature was likely used in the ggplot2 package.
#> Please report the issue at <https://github.com/tidyverse/ggplot2/issues>.
#> Warning: Vectorized input to `element_text()` is not officially supported.
#> ℹ Results may be unexpected or may change in future versions of ggplot2.
#> Note: Very wide confidence intervals detected. X-axis capped for readability.
#> `height` was translated to `width`.
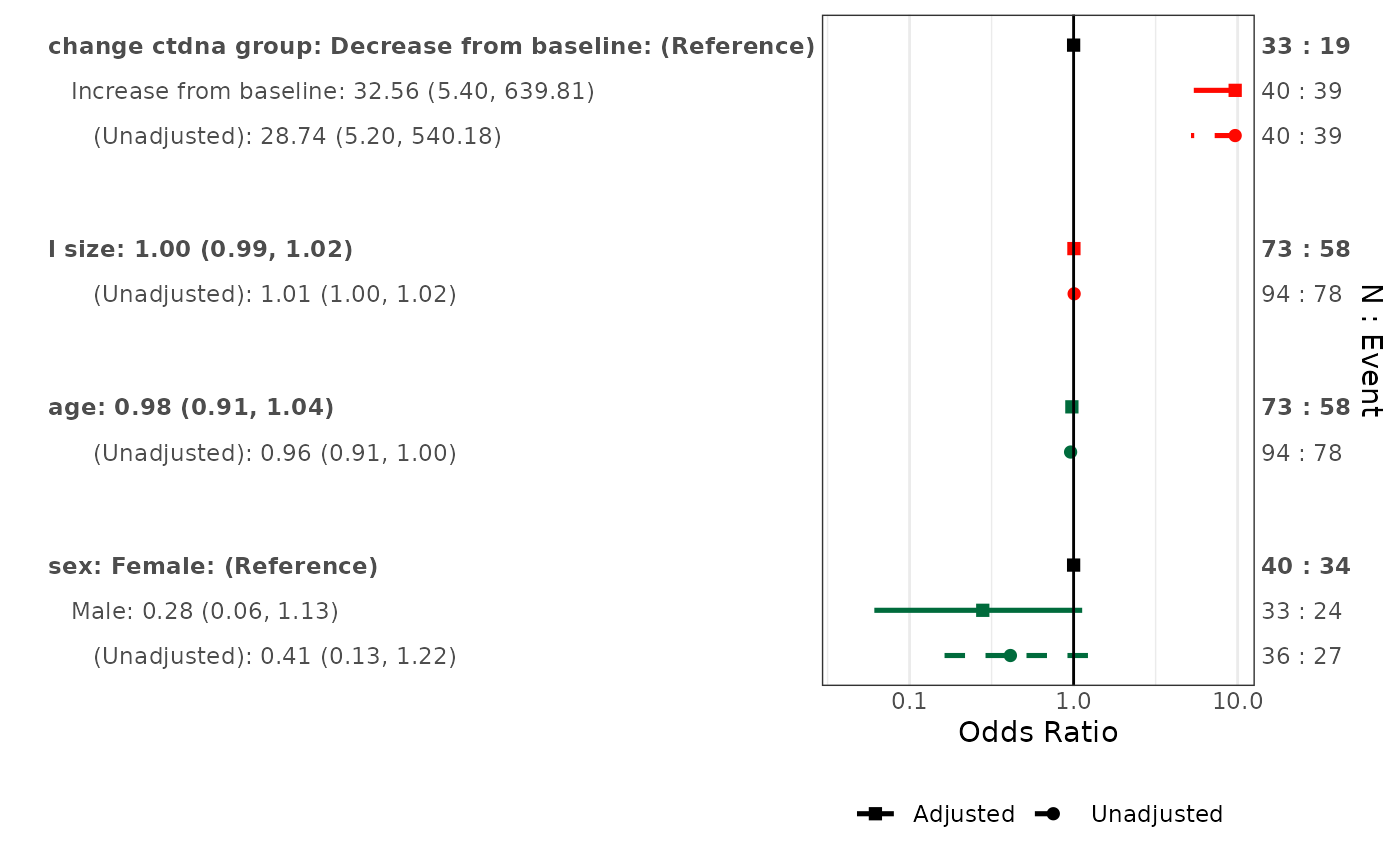
 # Both adjusted and unadjusted
forestplotMV(glm_fit, data = pembrolizumab, include_unadjusted = TRUE)
#> Fitting univariate models for each predictor
#> Note: Adjusted model N=73 may differ from unadjusted model N=94 due to missing data in covariates
#> Warning: Vectorized input to `element_text()` is not officially supported.
#> ℹ Results may be unexpected or may change in future versions of ggplot2.
#> Note: Very wide confidence intervals detected. X-axis capped for readability.
#> `height` was translated to `width`.
# Both adjusted and unadjusted
forestplotMV(glm_fit, data = pembrolizumab, include_unadjusted = TRUE)
#> Fitting univariate models for each predictor
#> Note: Adjusted model N=73 may differ from unadjusted model N=94 due to missing data in covariates
#> Warning: Vectorized input to `element_text()` is not officially supported.
#> ℹ Results may be unexpected or may change in future versions of ggplot2.
#> Note: Very wide confidence intervals detected. X-axis capped for readability.
#> `height` was translated to `width`.